Start with ECOGEN
Here is described your first use of ECOGEN: Running the default test case. This is what user should observe without any change in the downloaded ECOGEN package.
Important
Before starting with ECOGEN, you should have passed all steps of installation instructions of section Installation instructions.
The main input file
ECOGEN is mainly controlled thanks to the input file named ECOGEN.xml. This file looks like :
<?xml version = "1.0" encoding = "UTF-8" standalone = "yes"?>
<ecogen>
  <!-- Euler reference test cases -->
  <!-- -------------------------- -->
  <testCase>./libTests/referenceTestCases/euler/1D/transport/positiveVelocity/</testCase>
  <!-- <testCase>./libTests/referenceTestCases/euler/1D/transport/negativeVelocity/</testCase> -->
  <!-- <testCase>./libTests/referenceTestCases/euler/1D/shockTubes/HPLeft/</testCase> -->
</ecogen>
Each test case corresponds to specific input files organised in different folders and associated to a markup <testCase>.
When executing ECOGEN, it runs sequentially each test case corresponding to the uncommented lines present in the markup <ecogen>.
A unique line is uncommented in the original file and corresponds to the default test case. One should modify the ECOGEN.xml input file to run other provided test by uncommenting/commenting lines in this file. New lines can also be added when creating new test cases.
Running the default test case
The default test case provided with ECOGEN package is a single-phase flow test which simply advect a density discontinuity with a positive velocity in 1D. Input files for this test case are present in the folder ./libTests/referenceTestCases/euler/1D/transport/positiveVelocity/.
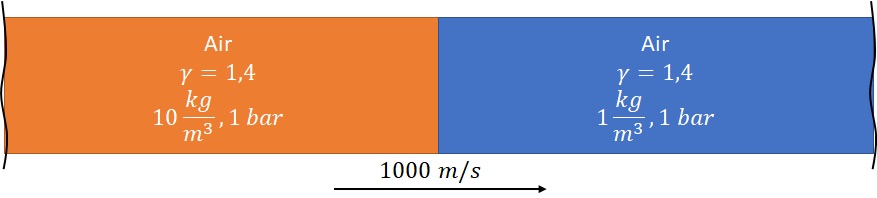
Fig. 5 Initial condition for 1D, single-phase transport test case.
The initial characteristics of the run are:
Characteristic |
value |
|---|---|
dimension |
1 m |
mesh size |
100 |
AMR max level |
3 |
discontinuity position |
0,5 m |
boundary conditions |
transmittive |
final solution time |
0.36 ms |
solution printing frequency |
0.036 ms |
This test can be executed on a single core or on XX cores by one of the commands:
./ECOGEN
mpirun -np XX ECOGEN
Note
Information on available cores can be obtained under linux system using the command:
/usr/bin/nproc
- The code is running and at the top of the console output one can read:
The console logo of ECOGEN
The name of the test case including the full path of the test case : ./libTests/referenceTestCases/euler/1D/transport/positiveVelocity/
Information concerning the number of iterations, the elapsed time, etc.
euler1DTransportPositiveVelocity is the name of the default run.
Fig. 6 Screenshot of the top of ECOGEN’s default run console. In this particular run, 8 cores have been used.
The run ends and the following information comes:
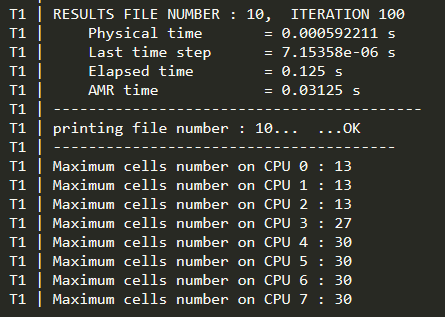
Fig. 7 Screenshot of the end of ECOGEN’s default run console with 8 cores used.
A new folder results is created at the first run. This folder contains a folder named euler1DTransportPositiveVelocity containing output files of our test case:
collectionParaview.pvd and collectionVisIt.visit used in Paraview and VisIt software,
datasets folder containing the associated vtu files,
infoCalcul.out,
infoMesh folder,
probes folder,
cuts folder,
savesInput folder; a kind of log folder that contains the XML files used for this run.
By default, output files are recorder in VTK XML format in separate files for each core and TIME. A way to post-treat this output files is to open the collectionParaview.pvd or collectionVisIt.visit file using Paraview or VisIt software.
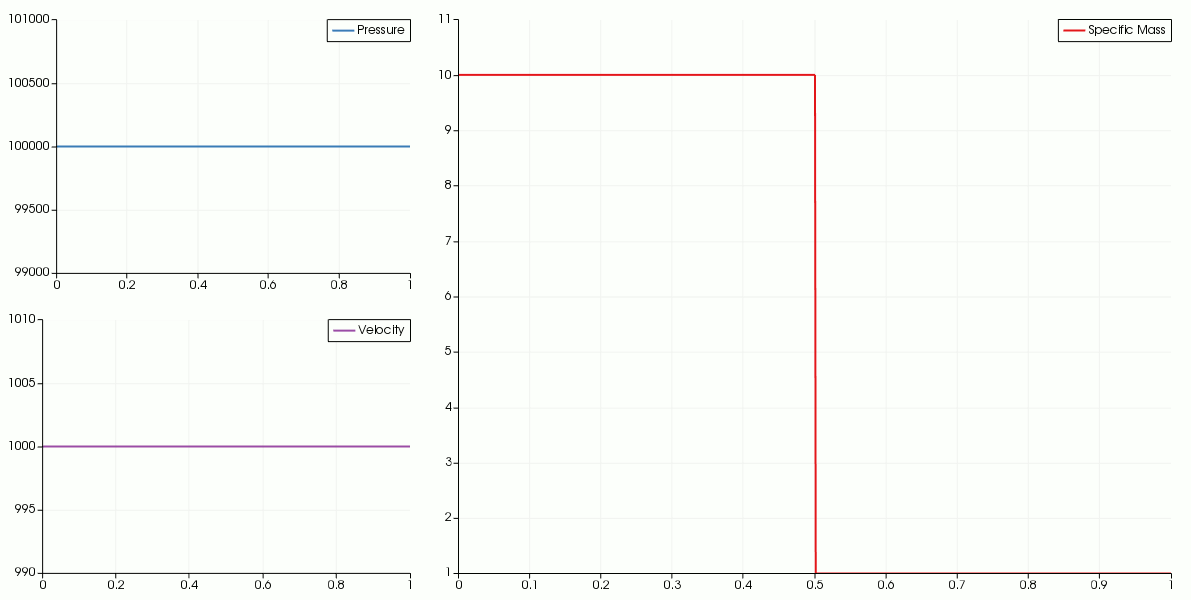
Fig. 8 Results for the single-phase transport test.
This basic test shows advection of a contact discontinuity while preserving pressure and velocity uniform.
Editing input files
Input files for this test case are located in the following folder: ./libTests/referenceTestCases/euler/1D/transport/positiveVelocity/.
Computation parameters are easily modified according to the input file description of section Input Files.
For example, one can prefer to visualize results under gnu file format. For that, simply turn the VTK option in the XML file libTestsreferenceTestCaseseuler1DtransportpositiveVelocitymain.xml into GNU and re-run the test case:
<outputMode format="GNU" binary="false" precision="10"/>
The results can be drawn by loading in the gnuplot software the file visualization.gnu.
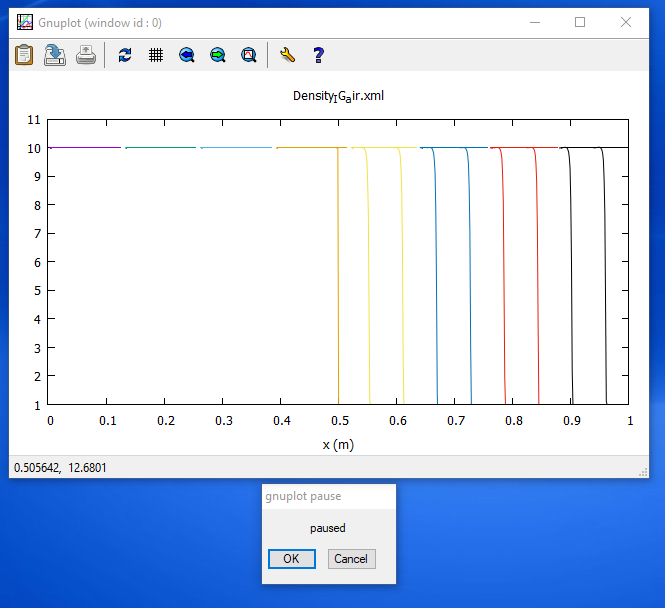
Fig. 9 Screenshot of results in gnuplot.