Spherical collapse
This case is a 2D Cartesian test case. This test case shows an air-bubble collapsing under the effect of water external pressure. There initially is a pressure gradient between the two regions. Initial conditions of this test are shown in Fig. 90. Input files for this test are available in ./libTests/referenceTestCases/PUEq/2D/sphericalCollapse/Pratio1427/. The corresponding uncommented line in ECOGEN.xml is:
<testCase>./libTests/referenceTestCases/PUEq/2D/sphericalCollapse/Pratio1427/</testCase>
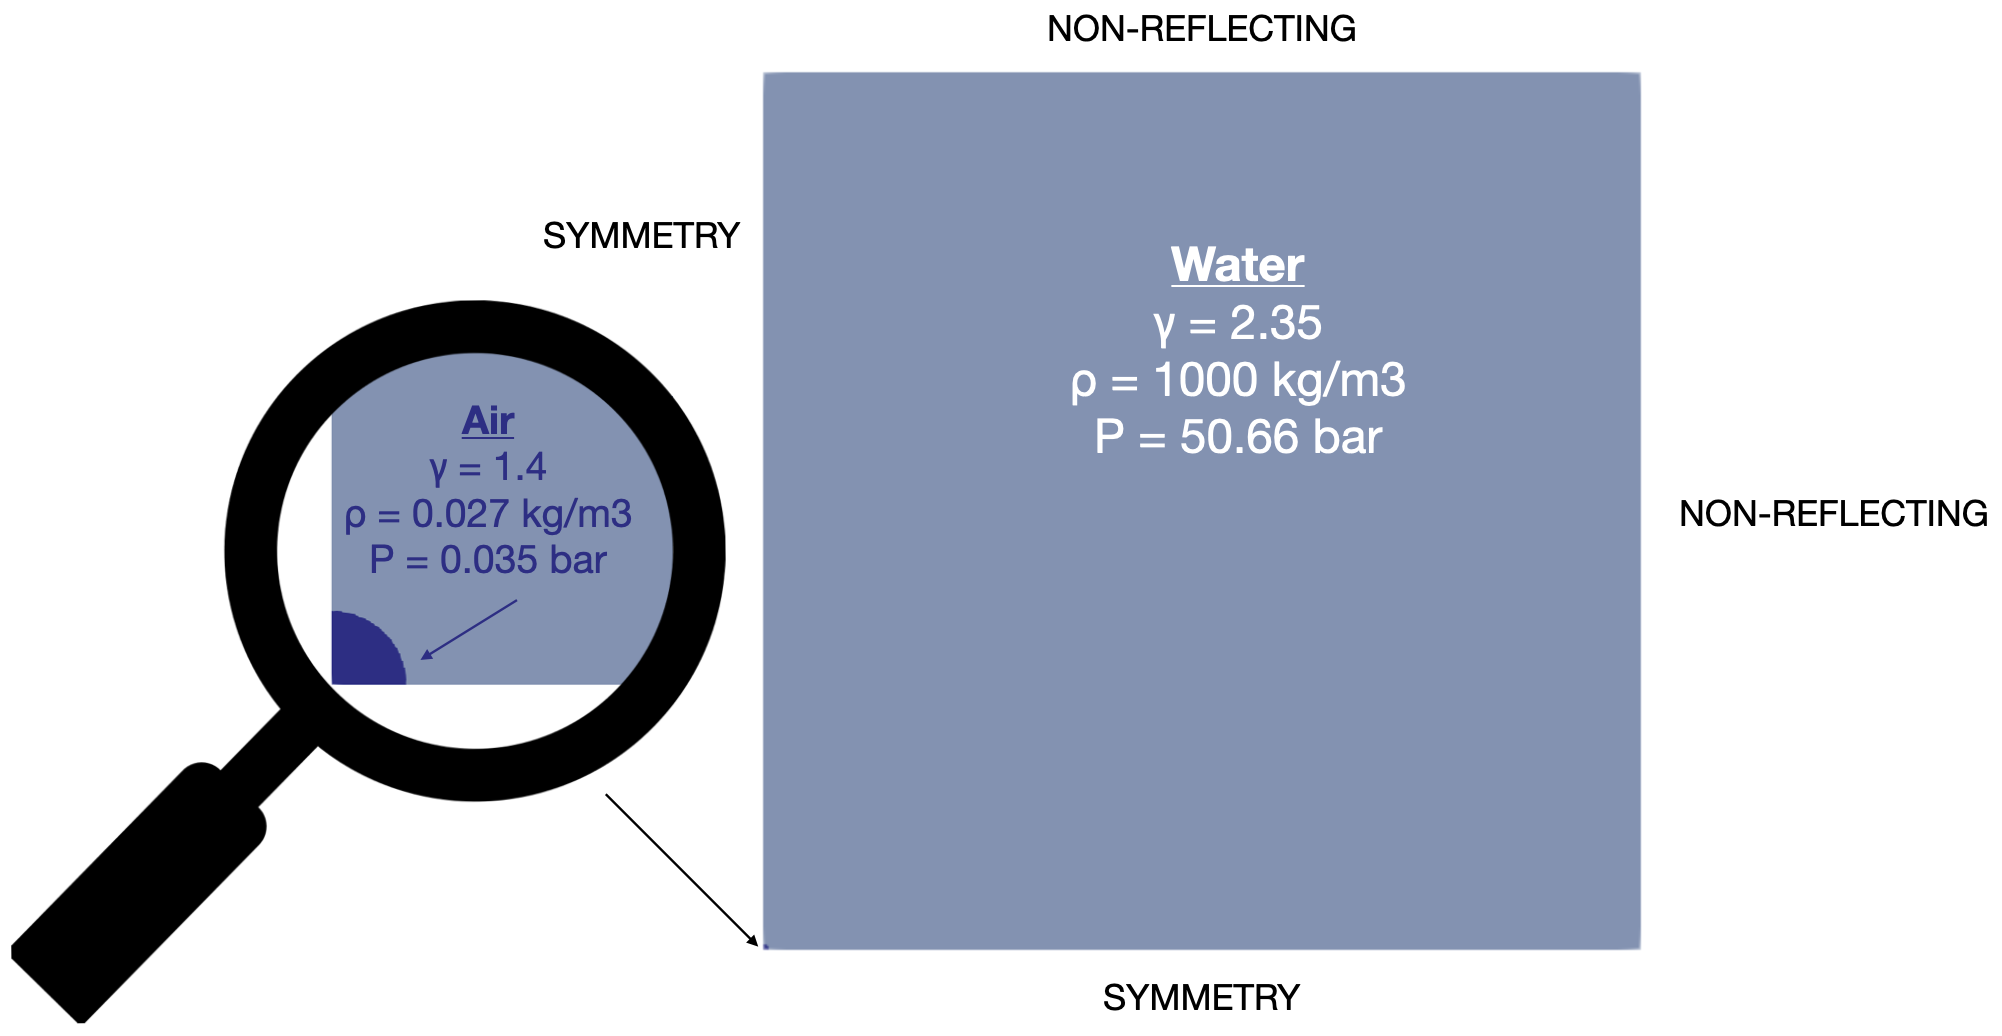
Fig. 90 Initial conditions.
A spherical air bubble is initialized at low pressure (approximately saturated vapor pressure) in the corner of a 2D-axisymmetric domain filled with water at high pressure (here P = 50 atm).
The initial characteristics of the run are:
Characteristic |
Value |
|---|---|
dimension |
3 mm x 3 mm |
mesh |
171 x 171 (stretching) |
boundary conditions |
symmetry ; non-reflecting |
final solution time |
2 e-6 s |
solution printing frequency |
2 e-9 s |
precision |
2nd order (MC + THINC) |
Note that the mesh has been modified to match a similar one than the 1D axi-symmetric spherical-collapse test case. Indeed, it uses a Cartesian mesh with uniform cell size from the origin to 0.3 mm (150 cells), then the mesh is stretched from 0.3 mm to 3 mm with a factor of 1.1 (51 cells). This in both x- and y-directions.
For this test case, we want to compar the numerical solution to the semi-analytic solution of Keller–Miksis in regard of the bubble-wall radius evolution. One can find details in [SBC20]. To obtain such a solution with ECOGEN, we need to integrate the bubble (air) volume fraction in order to recover its volume and therefore its mean radius. To do so, few lines in the code have to be uncommented (the integration is not generalized) following the instructions given in the Python post-treatment script sphericalCollapse_postTreatment.py. Finally, by executing the script using Python 3, we obtain the following plot (Fig. 91).
Note
Do not forget to recompile the code after uncommenting the lines and to recomment the lines and to recompile the code for other test cases.
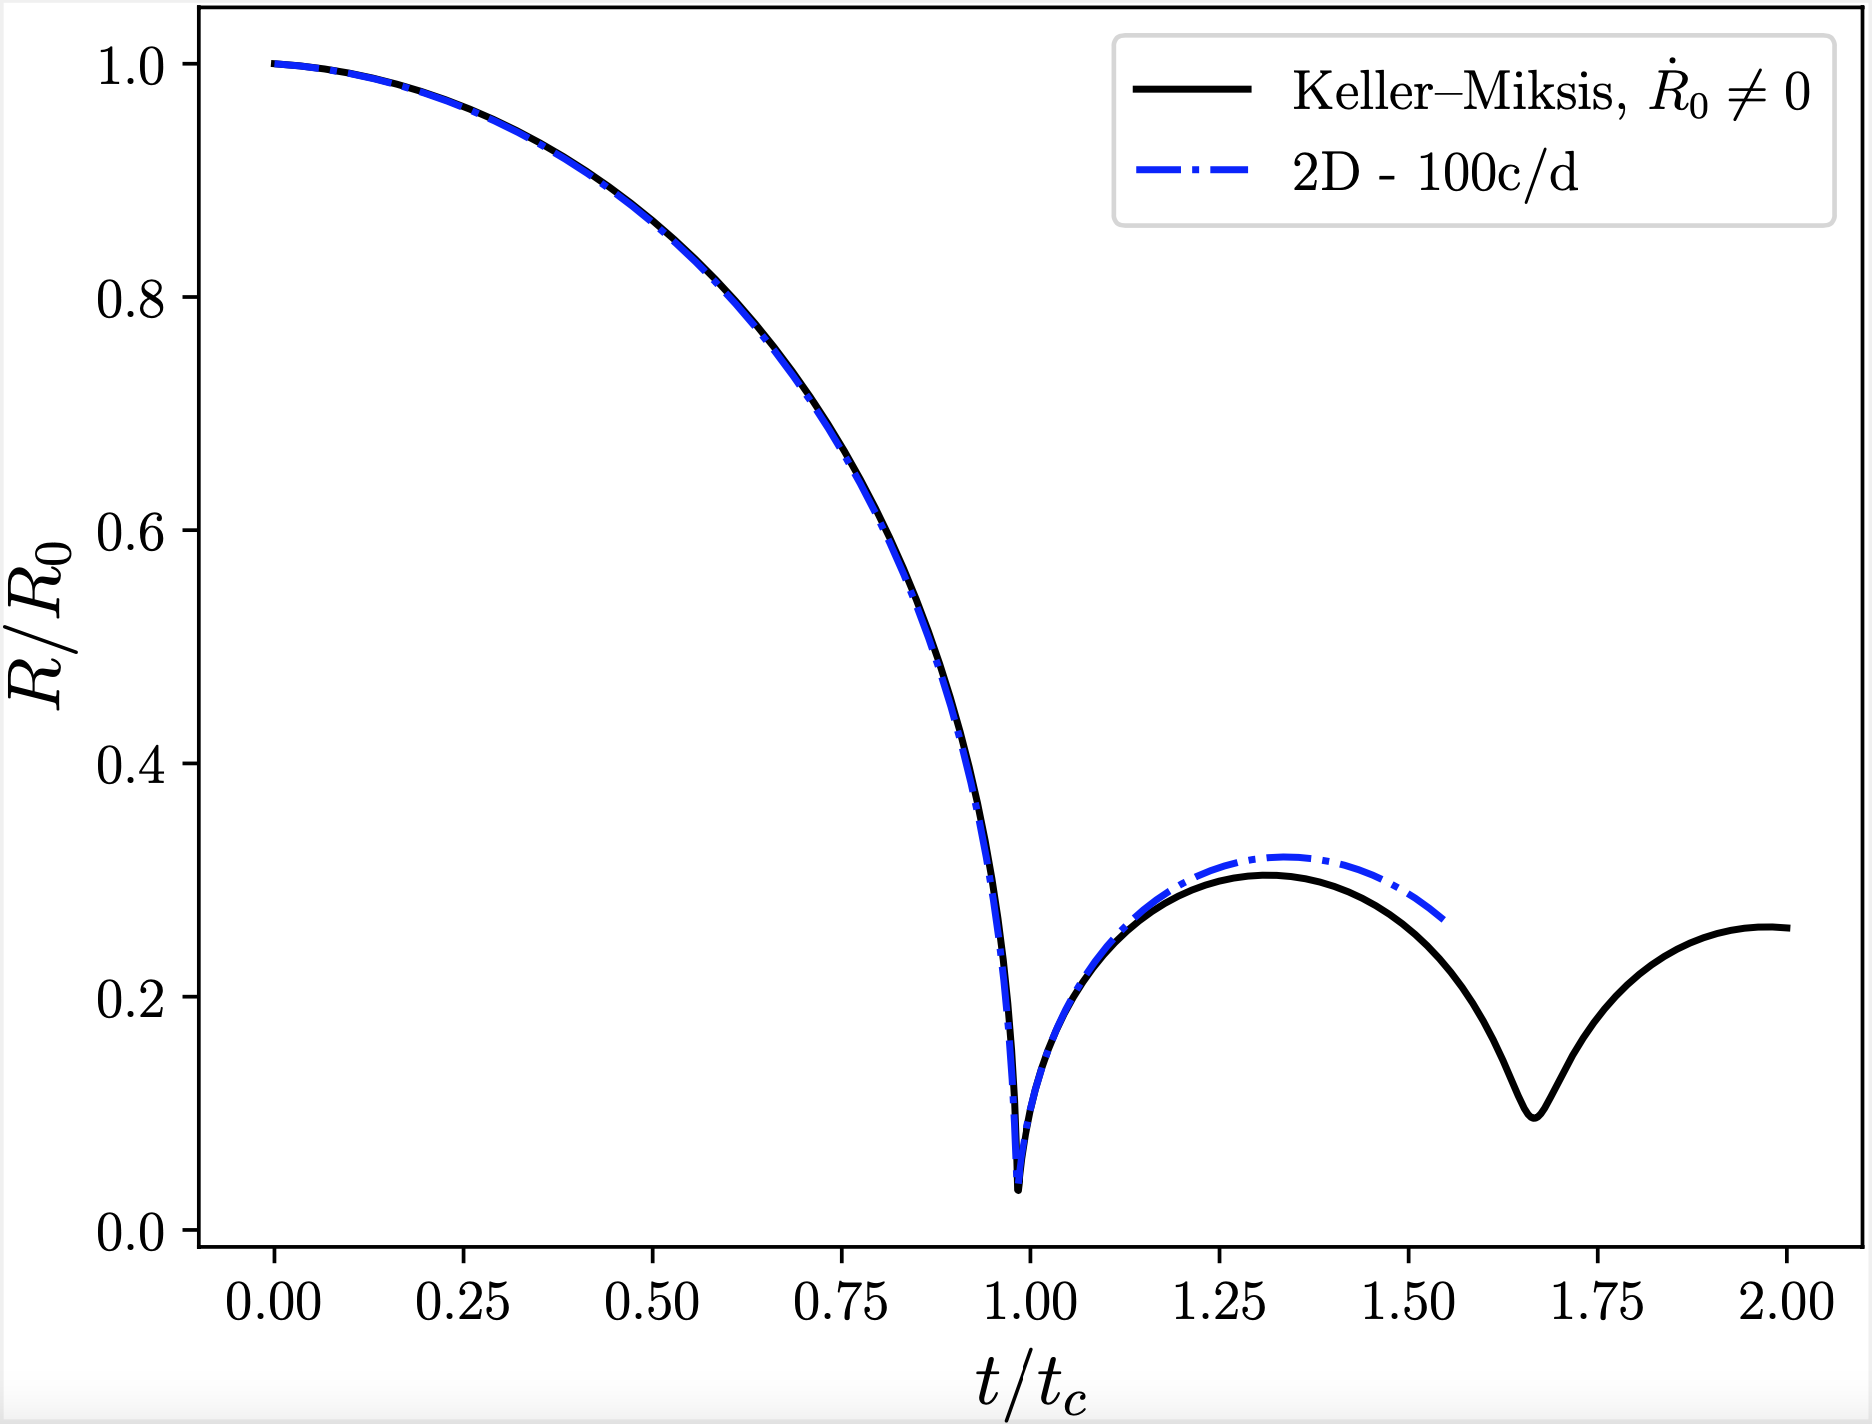
Fig. 91 Bubble-wall radius evolution over time from the numerical and semi-analytic solutions. Visualization using Python.
One can note that the radius evolutions are in very good agreement until the final collapse point. Then the solutions vary. Indeed, for a strong collapse like this one, error could appear from both the numerical and semi-analytical solutions and should not give the same solution. One can find details on the subject and solutions for a weaker collapse in [SBC20].