High-pressure regions
Single-phase high-pressure regions are proposed in the following test cases:
<testCase>./libTests/referenceTestCases/euler/2D/HPCenter/</testCase>
<testCase>./libTests/referenceTestCases/euler/2D/HPUnstructured/</testCase>
<testCase>./libTests/referenceTestCases/euler/3D/LPCenter/</testCase>
HP center
This case is a 2D Cartesian test case. The square domain is only composed of air, with two different pressures: 10 bars in the center, and 1 bar in the rest of the domain. Initial conditions are shown in Fig. 45. This test is referenced in ./libTests/referenceTestCases/euler/2D/HPCenter/. The corresponding uncommented line in ECOGEN.xml is:
<testCase>./libTests/referenceTestCases/euler/2D/HPCenter/</testCase>
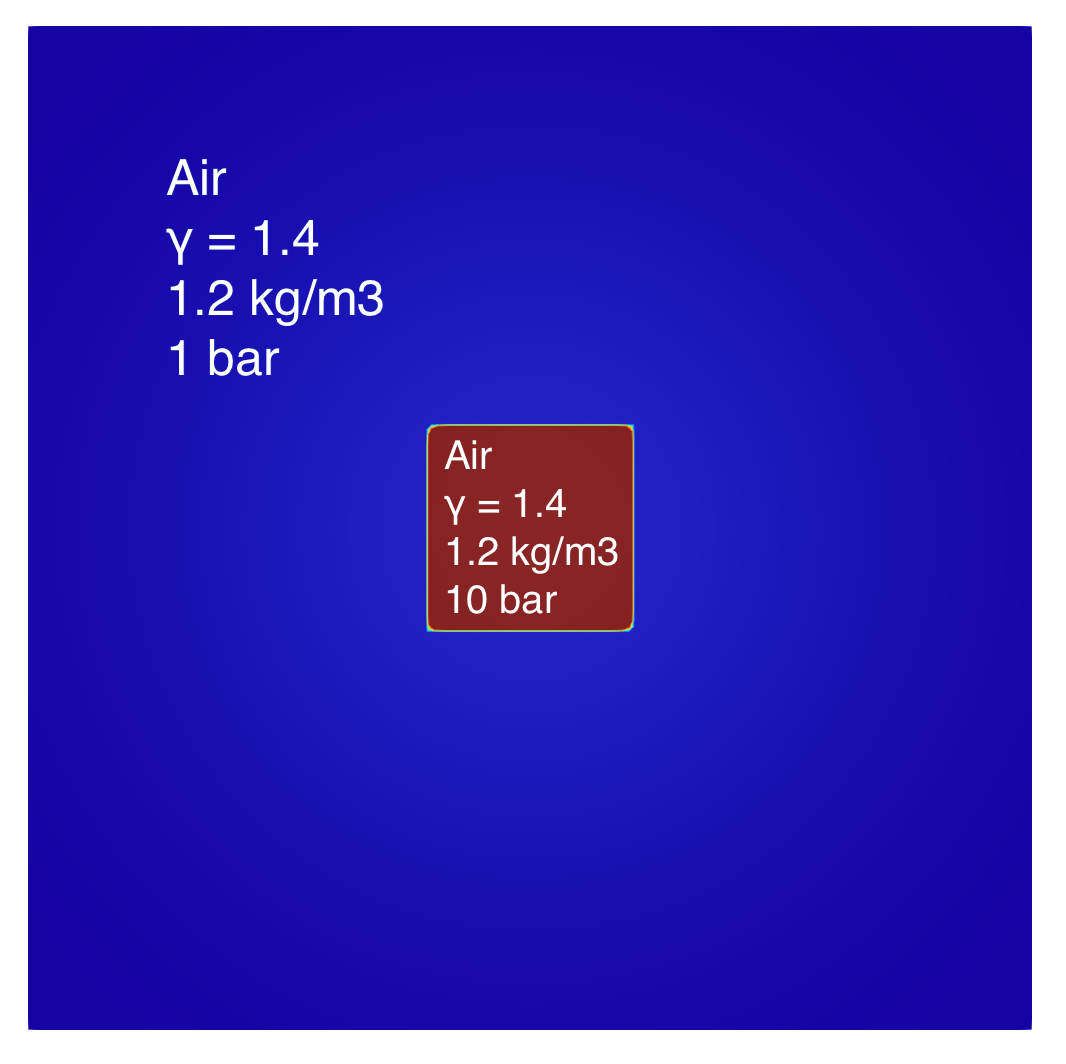
Fig. 45 Initial air conditions in the domain. Visualization using Paraview software.
The initial characteristics of the run are:
Characteristic |
Value |
|---|---|
Dimension |
1 m x 1 m |
Initial mesh size |
20 x 20 |
AMR max level |
3 |
Boundary conditions |
wall |
Final solution time |
1.2 ms |
Solution printing frequency |
0.60 ms |
Precision |
2nd order (VanLeer) |
Results are shown on figures Fig. 46 and Fig. 47. They show propagation of the shock wave over time. Note that the total time is 1.2ms and the cell number attributed to the stretched region has been increased compared to the original to present good image quality.

Fig. 46 Shock wave of a high-pressure rectangle of air. Schlieren visualization using Paraview software.
A shock wave propagates from the center to the wall. At the same time, expansion waves meet and create even more relaxation, which then propagate and meet again.
Fig. 47 Pressure in function of position at different time. Visualization using Paraview software.
A pressure discontinuity is observed because of the shock wave. One also obverses expansion waves where the pressure decreases.
HP unstructured
This is a case with an unstructured mesh generated with the open-source Gmsh software [GR09]. Initial conditions are shown in Fig. 48. The square domain is only composed of water, with two different pressures: 100 bars in the red “rectangle” and 1 bar in the blue region. This test is referenced in ./libTests/referenceTestCases/euler/2D/HPUnstructured/. The corresponding uncommented line in ECOGEN.xml is:
<testCase>./libTests/referenceTestCases/euler/2D/HPUnstructured/</testCase>
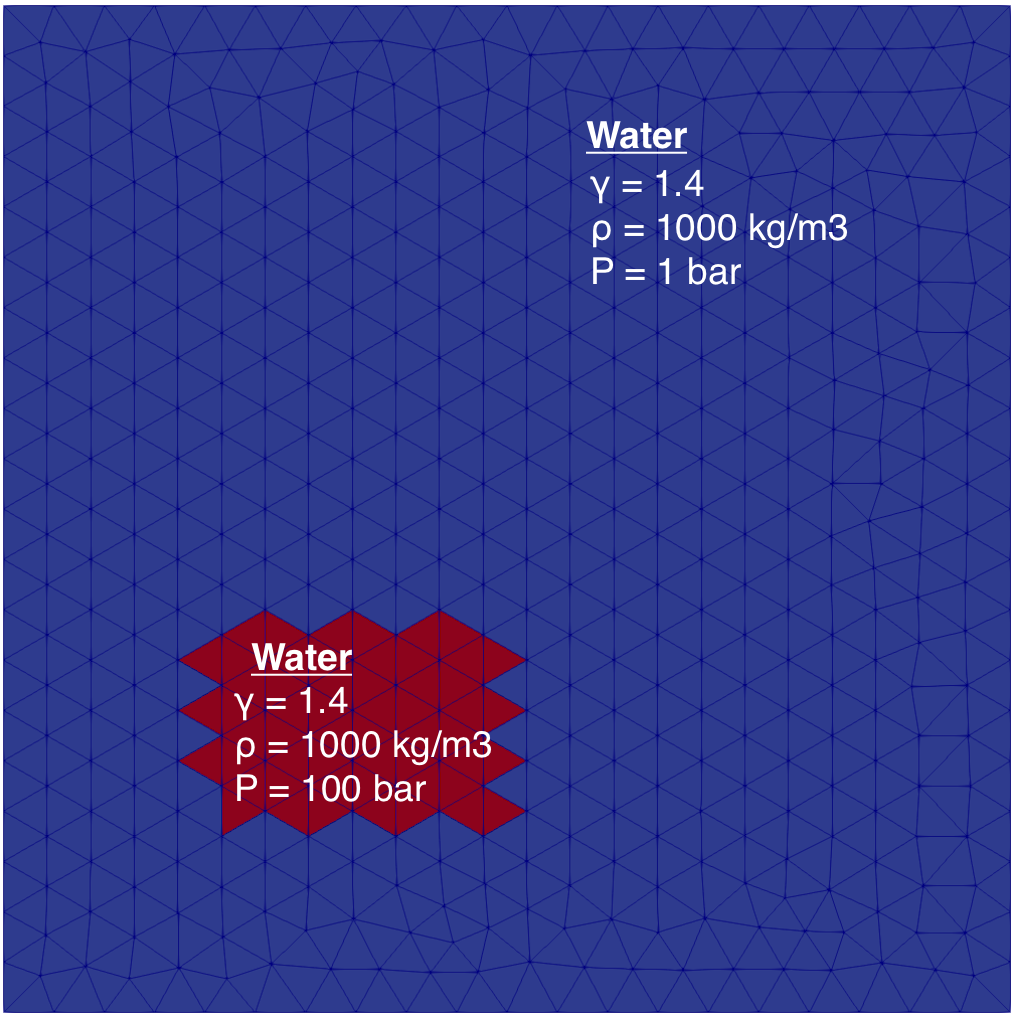
Fig. 48 Initial water conditions in the domain. Visualization using Paraview software.
The initial characteristics of the run are:
Characteristic |
Value |
|---|---|
Dimension |
1 m x 1 m |
Initial mesh structure |
unstructured |
Boundary conditions |
wall |
Final solution time |
60 ms |
Solution printing frequency |
5.e-2 ms |
This unstructured mesh is generated by Gmsh, and referenced in ./libMeshes/square/.
There is a pressure gradient between the two regions, high pressure at t=0s is contained in the “rectangle”. When the interface between the blue and the red regions disappears, the red region relaxes, causing an increase in pressure in the blue region. With the evolution of density, it is easier to observe that a shock wave propagates in the domain.

Fig. 49 Shock vawe of a high-pressure rectangle of air (pressure evolution over time). Visualization using Paraview software.

Fig. 50 Shock vawe of a high-pressure rectangle of air (density evolution over time). Visualization using Paraview software.